
Mobile Game Microtransaction Analysis
Data Analysis & Notebook Visualization
Project Outcomes:
This project explores mobile game in-app purchase data. The goal is to identify which demographics are more or less likely to purchase microtransactions—whether by gender, country, or other factors. We also look at which genres of mobile games drive the highest spending, and which ones encourage players to start spending the fastest.
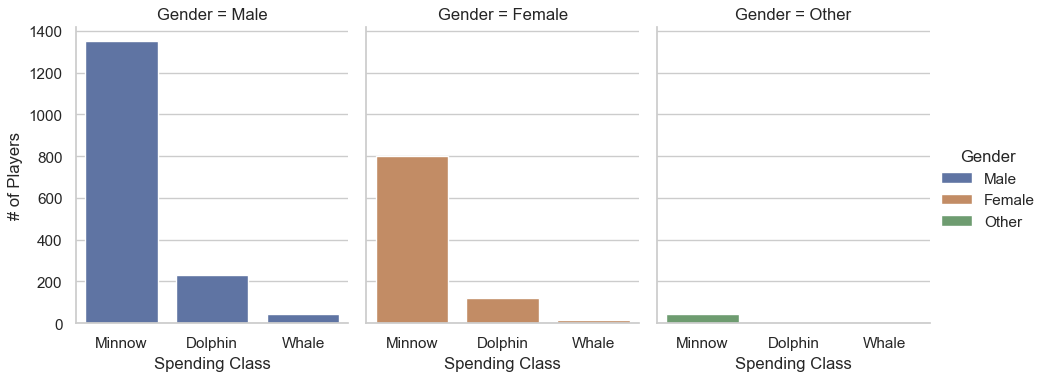
Gender
Gender was divided into 3 categories: male, female, and other. On average, men tended to spend more than women, and were more likely to be classed as "whales" (extremely heavy spenders). There wasn’t really a difference between men and women when it came to how long it took for them to make in-app purchases. While women aren’t too far behind, it’s clear that men spend moderately more on mobile gaming than women do.
Interestingly, those who classify their gender as neither male nor female tended to spend MUCH less on microtransactions (less than $40 on average) while also taking a little longer to first start spending. This could indicate that either mobile games aren’t an interest for people who identify as "other," or that there is an untapped market for mobile games appealing to this group.


Country:
Among the lowest average spenders in mobile game microtransactions are the Netherlands, Australia, France, etc. Similar to the situation with non-binary individuals, either demand for mobile gaming is weak in these countries, or a market to appeal to these countries has not yet formed The highest average spenders include countries like Bangladesh, Canada, Russia, and especially Afghanistan, which ranks as the absolute highest spender.

IMPORTANT CONTEXT : People who spend money on mobile games are separated into 3 categories
Minnow : Light and occasional spending
Dolphin : Consistent and moderate spending
Whale : Very frequent and heavy spending
Game Genre:
Between all the game genres, there isn’t a notable difference in which genres encourage first spending the quickest, ranging usually from 7–23 days. Most genres’ median in this regard is 15–17 days, although MOBAs sit at 19 days. Average spending between genres has more variance, however. Battle Royale, Fighting, Racing, Strategy, and MOBA games all sit at the top, promoting an average of $130–$170 per player.
At the bottom are Action RPG and Sandbox games at only $60. Weak spending from game genres tends to be due to a lack of public interest in said genre across all demographics, rather than a case of untapped markets. To maximize profits, sticking to genres like Battle Royale would be most optimal.


Final Conclusions:
If attempting to maximize profits in established markets, Battle Royale games appealing to men and deployed in countries like Afghanistan and Bangladesh would be best. If attempting to take advantage of overlooked markets, appealing to non-binary individuals and/or deploying in countries like the Netherlands and France might prove fruitful, although the usual most successful game genres would still be optimal in this scenario.
Limitations:
Since understanding what aspects of a mobile game may appeal to different demographics is not within the scope of this project, a separate report may have to be developed in order to understand how to properly appeal to genders, countries, etc. That being said, a visualization like that combined with this analysis could reveal a reliable path towards optimal revenue in the mobile gaming market.